- 1 Introduction
- 2 Basic data description
- 3 Characteristics of the respondents
- 4 Household Composition
- 5 Income Sources & Shares
- 6 Crops Cultivated
- 7 Land
- 8 Food Security
- 9 Nutrition
- 10 Loans
Analysis of the Cocoa Livelihood survey
KIT - Sustainable Economic Development
23 August 2018
1 Introduction
This document summarizes the draft analysis of the survey data from the Cocoa livelihoods study, collected between 29/Nov/2016 and 21/Mar/2017
2 Basic data description
There are 3045 surveys
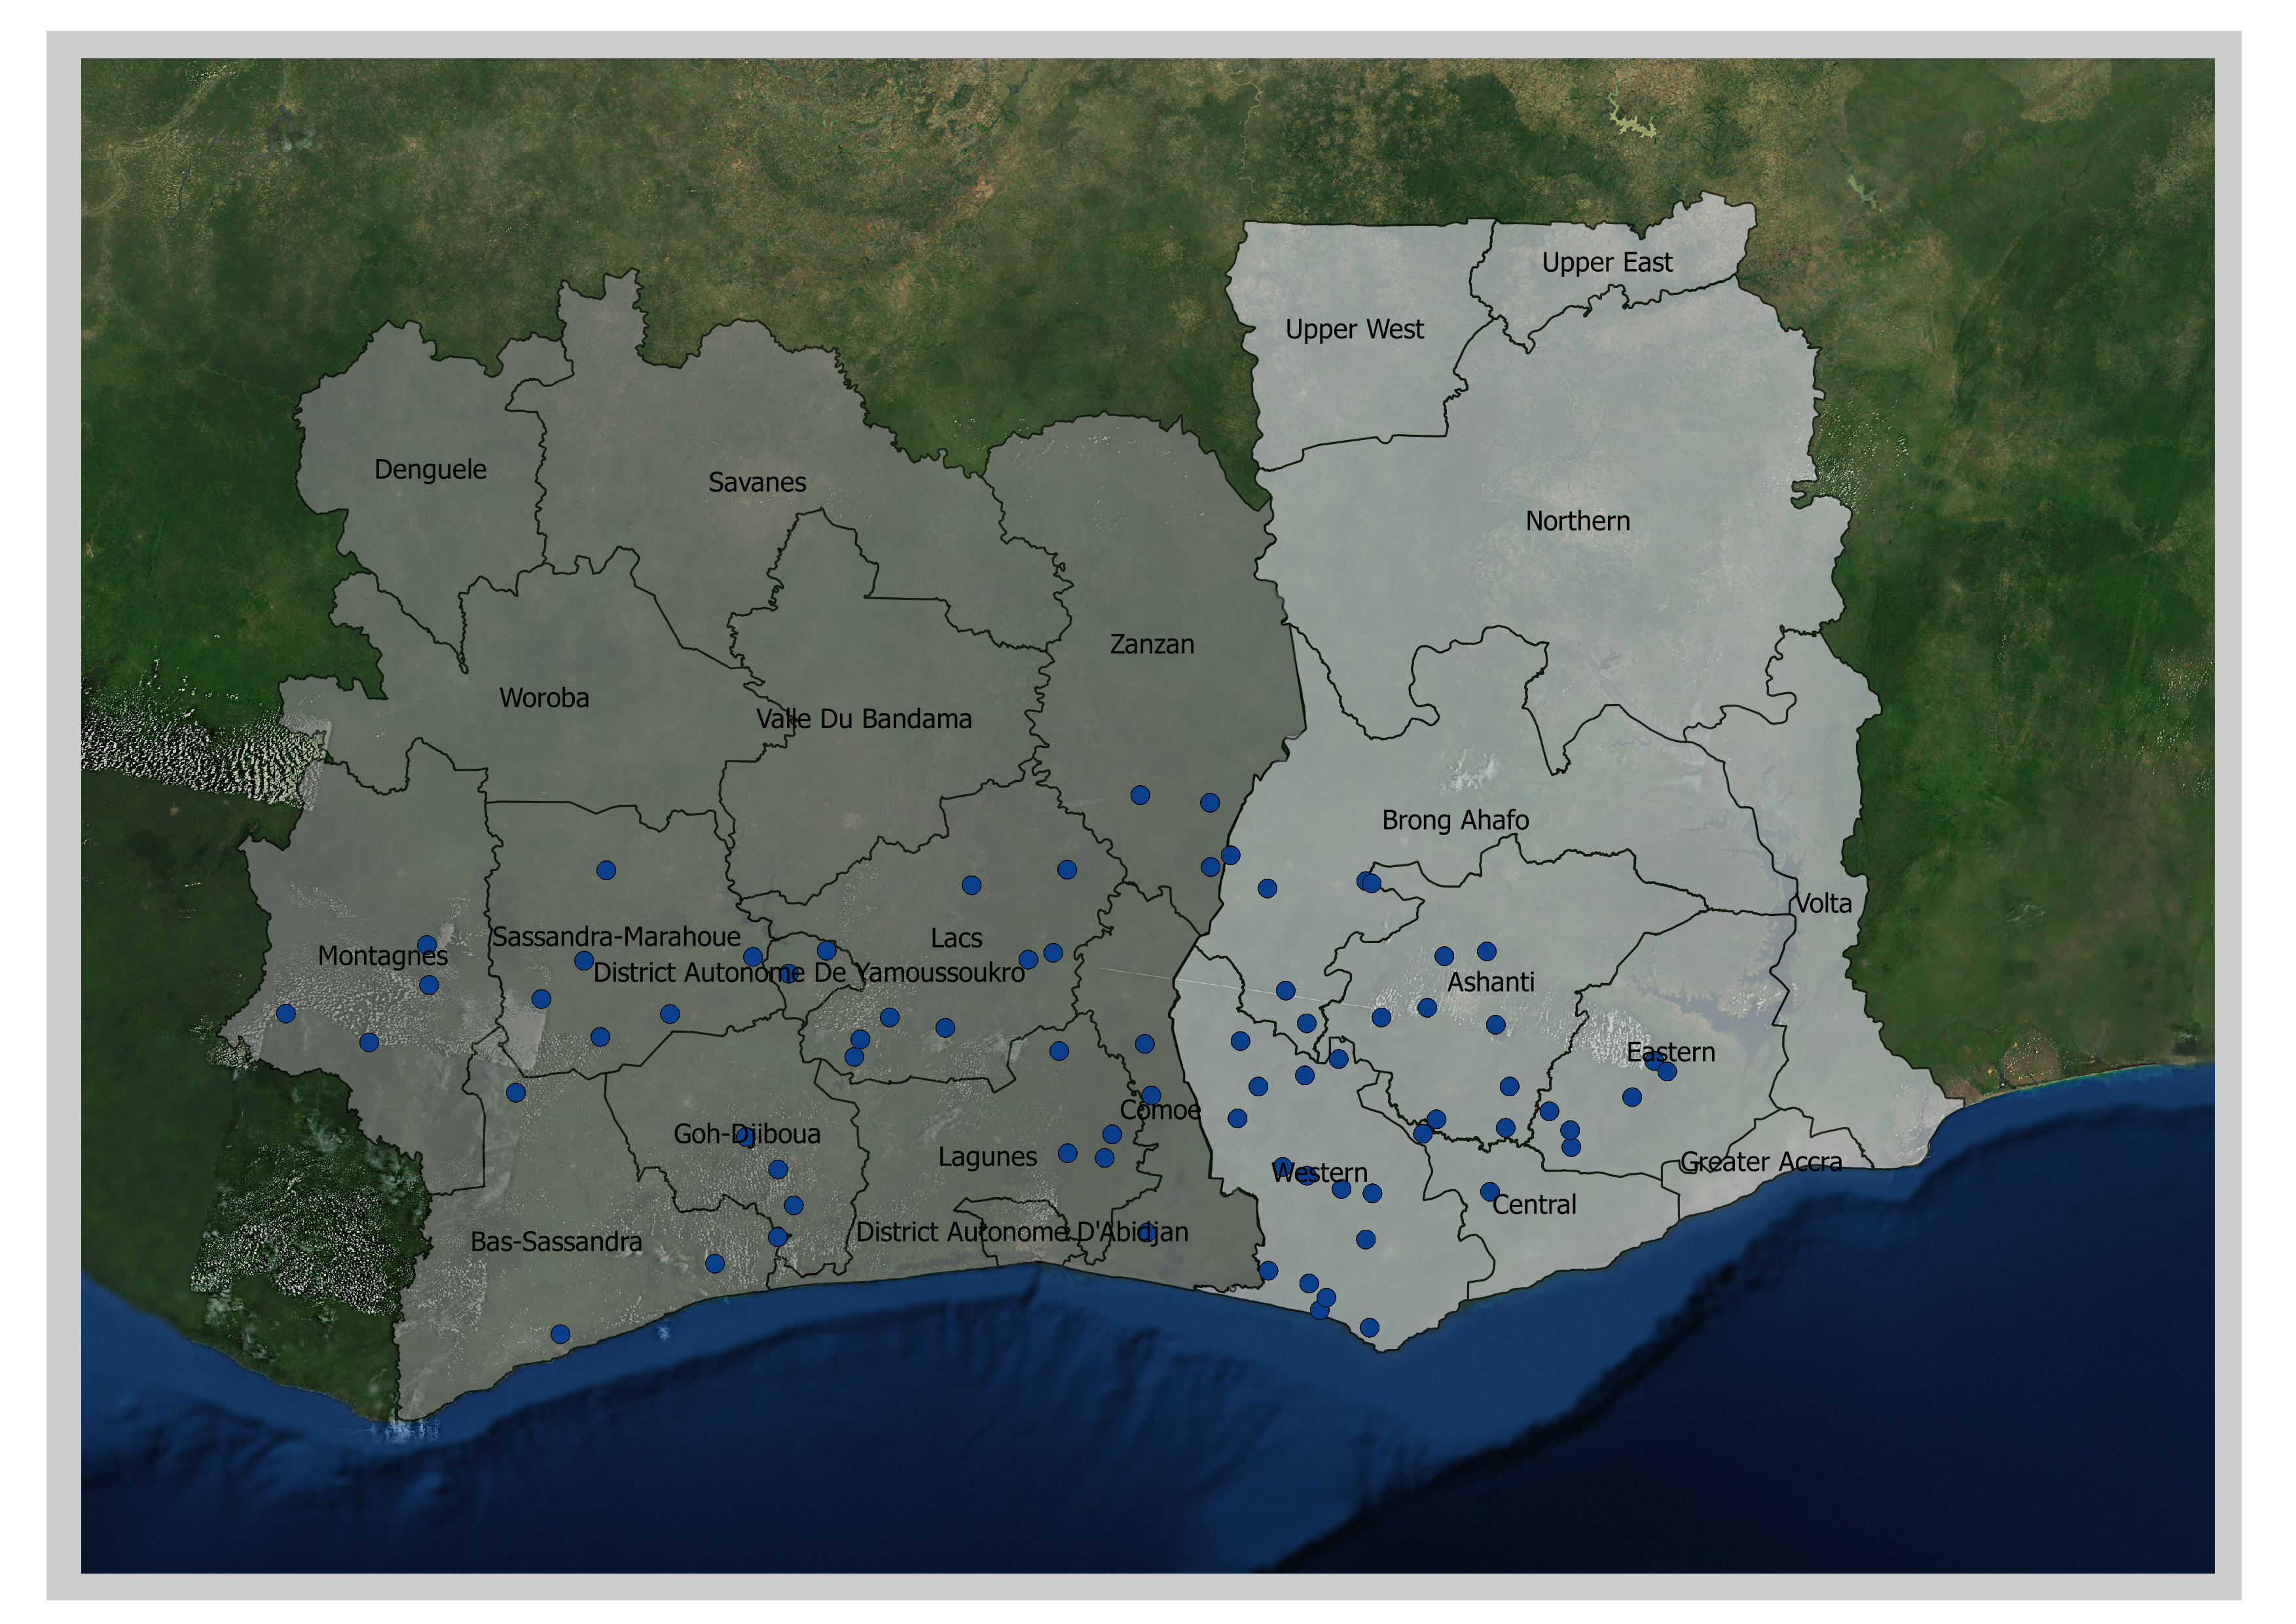
Survey locations
## Survey Note: Added variable based on Country data source3 Characteristics of the respondents
## p-value of Chi-squared test: 0.58
## Survey Note: Original English Survey Question: "Gender"## p-value of Chi-squared test: 0.00 ***
## Survey Note: Original English Survey Question: "Are you the head of the household? (the respondent)"## Within Ghana: p-value of Chi-squared test: 0.00 ***
## Within CdI: p-value of Chi-squared test: 0.00 ***
## Survey Note: Original English Survey Question: "Are you the head of the household? (the respondent)"## p-value of Chi-squared test: 0.00 ***## Within Ghana: p-value of Chi-squared test: 0.26
## Within CdI: p-value of Chi-squared test: 0.00 ***## p-value of Chi-squared test: 0.00 ***
## Survey Note: Original English Survey Question: "What is your marital status? "## Within Ghana: p-value of Chi-squared test: 0.00 ***
## Within CdI: p-value of Chi-squared test: 0.00 ***
## Survey Note: Original English Survey Question: "What is your marital status? "## p-value of Chi-squared test: 0.00 ***
## Survey Note: Original English Survey Question: "What was the highest level of education you completed?"## Within Ghana: p-value of Chi-squared test: 0.00 ***
## Within CdI: p-value of Chi-squared test: 0.00 ***
## Survey Note: Original English Survey Question: "What was the highest level of education you completed?"## p-value of Chi-squared test: 0.00 ***
## Survey Note: Original English Survey Question: "Are you able to read a sentence in English?"## Within Ghana: p-value of Chi-squared test: 0.00 ***
## Within CdI: p-value of Chi-squared test: 0.00 ***
## Survey Note: Original English Survey Question: "Are you able to read a sentence in English?"4 Household Composition
## p-value of Chi-squared test: 0.00 ***
## Survey Note: Calculate variable, based on respondent 1 or respondent 2## Within Ghana: p-value of Chi-squared test: 0.00 ***
## Within CdI: p-value of Chi-squared test: 0.00 ***
## Survey Note: Calculate variable, based on respondent 1 or respondent 26 Crops Cultivated
## p-value of Chi-squared test: 0.00 ***
## Survey Note: Original English Survey Question: "What was your household's MOST important crop last year?"## Within Ghana: p-value of Chi-squared test: 0.09 *
## Within CdI: p-value of Chi-squared test: 0.00 ***
## Survey Note: Original English Survey Question: "What was your household's MOST important crop last year?"## p-value of Chi-squared test: 0.00 ***
## Survey Note: Original English Survey Question: "What was you household's SECOND MOST important crop last year?"## Within Ghana: p-value of Chi-squared test: 0.00 ***
## Within CdI: p-value of Chi-squared test: 0.00 ***
## Survey Note: Original English Survey Question: "What was you household's SECOND MOST important crop last year?"| Summary Statistics | Group: Ghana (N = 1560) | Group: CdI (N = 1485) |
|---|---|---|
| Number of Crops | ||
| min | 0 | 0 |
| max | 17 | 15 |
| median (IQR) | 5.00 (3.00, 6.00) | 5 (3.00, 8.00) |
| mean (95% CI) | 5.00 (4.88, 5.13) | 5.84 (5.68, 6.01) |
## p-value of One way ANOVA test: 0.00 ***| Summary Statistics | Group: Ghana Female head (N = 288) | Group: Ghana Male head (N = 1270) | Group: CdI Female head (N = 157) | Group: CdI Male head (N = 1323) |
|---|---|---|---|---|
| Number of Crops | ||||
| min | 0 | 0 | 0 | 0 |
| max | 17 | 16 | 13 | 15 |
| median (IQR) | 4.00 (3.00, 6.00) | 5.00 (3.00, 6.00) | 5 (3.00, 8.00) | 5 (3.00, 8.00) |
| mean (95% CI) | 4.79 (4.50, 5.08) | 5.05 (4.91, 5.19) | 5.29 (4.81, 5.76) | 5.92 (5.75, 6.10) |
## Within Ghana: p-value of One way ANOVA test: 0.12
## Within CdI: p-value of One way ANOVA test: 0.02 **| Summary Statistics | Group: Ghana (N = 1560) | Group: CdI (N = 1485) |
|---|---|---|
| Number of Crops | ||
| min | 0 | 0 |
| max | 14 | 11 |
| median (IQR) | 3.00 (2.00, 4.00) | 2 (1.00, 4.00) |
| mean (95% CI) | 3.33 (3.24, 3.42) | 2.81 (2.72, 2.91) |
## p-value of One way ANOVA test: 0.00 ***| Summary Statistics | Group: Ghana Female head (N = 288) | Group: Ghana Male head (N = 1270) | Group: CdI Female head (N = 157) | Group: CdI Male head (N = 1323) |
|---|---|---|---|---|
| Number of Crops | ||||
| min | 0 | 0 | 0 | 0 |
| max | 14 | 14 | 11 | 11 |
| median (IQR) | 3.00 (2.00, 4.00) | 3.00 (2.00, 4.00) | 2 (1.00, 3.00) | 2 (2.00, 4.00) |
| mean (95% CI) | 3.08 (2.87, 3.28) | 3.39 (3.29, 3.49) | 2.40 (2.12, 2.69) | 2.87 (2.77, 2.97) |
## Within Ghana: p-value of One way ANOVA test: 0.01 ***
## Within CdI: p-value of One way ANOVA test: 0.00 ***7 Land
## p-value of Chi-squared test: 0.00 ***
## Survey Note: Original English Survey Question: "What land unit do you know best in your village?"## Within Ghana: p-value of Chi-squared test: 0.31
## Within CdI: p-value of Chi-squared test: 0.00 ***
## Survey Note: Original English Survey Question: "What land unit do you know best in your village?"## p-value of Chi-squared test: 0.01 **
## Survey Note: Original English Survey Question: "Do you know how many your household used to cultivate ALL crops last year?"## Within Ghana: p-value of Chi-squared test: 0.00 ***
## Within CdI: p-value of Chi-squared test: 0.00 ***
## Survey Note: Original English Survey Question: "Do you know how many your household used to cultivate ALL crops last year?"| Summary Statistics | Group: Ghana (N = 1360) | Group: CdI (N = 1236) |
|---|---|---|
| land (ha) | ||
| min | 0.2 | 0.0 |
| max | 18.62 | 22.00 |
| median (IQR) | 3.84 (2.43, 6.07) | 4.25 (2.50, 7.25) |
| mean (95% CI) | 4.75 (4.57, 4.94) | 5.41 (5.18, 5.65) |
## p-value of One way ANOVA test: 0.00 ***
## Survey Note: Calculated variable| Summary Statistics | Group: Ghana Female head (N = 239) | Group: Ghana Male head (N = 1119) | Group: CdI Female head (N = 116) | Group: CdI Male head (N = 1115) |
|---|---|---|---|---|
| land (ha) | ||||
| min | 0.35 | 0.20 | 0.00 | 0.00 |
| max | 17.92 | 18.62 | 19.00 | 22.00 |
| median (IQR) | 3.04 (1.90, 4.88) | 4.05 (2.43, 6.36) | 1.62 (0.75, 3.50) | 4.50 (2.50, 7.50) |
| mean (95% CI) | 3.83 (3.46, 4.21) | 4.95 (4.74, 5.16) | 2.96 (2.32, 3.59) | 5.69 (5.44, 5.93) |
## Within Ghana: p-value of One way ANOVA test: 0.00 ***
## Within CdI: p-value of One way ANOVA test: 0.00 ***
## Survey Note: Calculated variable| Summary Statistics | Group: Ghana (N = 1350) | Group: CdI (N = 1115) |
|---|---|---|
| land (ha) | ||
| min | 0 | 0 |
| max | 18.62 | 30.00 |
| median (IQR) | 3.03 (1.23, 5.26) | 6.50 (4.00, 11.00) |
| mean (95% CI) | 3.94 (3.74, 4.14) | 8.03 (7.68, 8.37) |
## p-value of One way ANOVA test: 0.00 ***
## Survey Note: Calculated variable| Summary Statistics | Group: Ghana Female head (N = 238) | Group: Ghana Male head (N = 1110) | Group: CdI Female head (N = 103) | Group: CdI Male head (N = 1008) |
|---|---|---|---|---|
| land (ha) | ||||
| min | 0 | 0 | 0 | 0 |
| max | 16.19 | 18.62 | 25.25 | 30.00 |
| median (IQR) | 2.83 (1.21, 4.35) | 3.21 (1.23, 5.67) | 3.00 (1.00, 5.50) | 7.00 (4.00, 11.50) |
| mean (95% CI) | 3.42 (3.04, 3.80) | 4.06 (3.83, 4.29) | 4.54 (3.60, 5.48) | 8.40 (8.04, 8.77) |
## Within Ghana: p-value of One way ANOVA test: 0.02 **
## Within CdI: p-value of One way ANOVA test: 0.00 ***
## Survey Note: Calculated variable| Summary Statistics | Group: Ghana (N = 1360) | Group: CdI (N = 1234) |
|---|---|---|
| land (ha) | ||
| min | 0 | 0 |
| max | 8.09 | 8.00 |
| median (IQR) | 0.00 (0.00, 0.00) | 0.00 (0.00, 0.00) |
| mean (95% CI) | 0.12 (0.08, 0.15) | 0.16 (0.12, 0.20) |
## p-value of One way ANOVA test: 0.10
## Survey Note: Calculated variable| Summary Statistics | Group: Ghana Female head (N = 239) | Group: Ghana Male head (N = 1119) | Group: CdI Female head (N = 116) | Group: CdI Male head (N = 1113) |
|---|---|---|---|---|
| land (ha) | ||||
| min | 0 | 0 | 0 | 0 |
| max | 7.08 | 8.09 | 2.00 | 8.00 |
| median (IQR) | 0.00 (0.00, 0.00) | 0.00 (0.00, 0.00) | 0.00 (0.00, 0.00) | 0.00 (0.00, 0.00) |
| mean (95% CI) | 0.13 (0.04, 0.22) | 0.12 (0.08, 0.15) | 0.05 (0.01, 0.09) | 0.17 (0.13, 0.22) |
## Within Ghana: p-value of One way ANOVA test: 0.78
## Within CdI: p-value of One way ANOVA test: 0.07 *
## Survey Note: Calculated variable8 Food Security
Respondents with 3 meals a day
9 Nutrition
Nutriont section was built upon the Minimum Dietary Diversity Score for Women.
Details can be found here
Only asked to Female respondents in reproductive age (between 15 and 49 years old)
Share of women 15-49 years of age who consumed each food group in the previous 24 hours
Number of food groups consumed by women 15-49 years of age in the previous 24 hours.
| Summary Statistics | Group: Ghana (N = 230) | Group: CdI (N = 293) |
|---|---|---|
| WDDS | ||
| min | 1 | 0 |
| max | 10 | 9 |
| median (IQR) | 5.00 (4.00, 6.00) | 4 (3.00, 5.00) |
| mean (95% CI) | 5.15 (4.93, 5.37) | 4.06 (3.91, 4.21) |
## p-value of Chi-squared test: 0.00 ***| Summary Statistics | Group: Ghana Female head (N = 96) | Group: Ghana Male head (N = 132) | Group: CdI Female head (N = 57) | Group: CdI Male head (N = 234) |
|---|---|---|---|---|
| WDDS | ||||
| min | 2 | 1 | 1 | 1 |
| max | 10 | 10 | 9 | 9 |
| median (IQR) | 5.00 (4.00, 6.00) | 5.00 (4.00, 6.00) | 4 (3.00, 4.00) | 4.00 (3.00, 5.00) |
| mean (95% CI) | 4.92 (4.58, 5.25) | 5.31 (5.02, 5.60) | 3.75 (3.41, 4.10) | 4.15 (3.99, 4.32) |
## Within Ghana: p-value of Chi-squared test: 0.28
## Within CdI: p-value of Chi-squared test: 0.11Dichotomous indicator of whether or not women 15-49 years of age have consumed at least five out of ten food groups in the previous 24 hours.
## p-value of Chi-squared test: 0.00 ***## Within Ghana: p-value of Chi-squared test: 0.26
## Within CdI: p-value of Chi-squared test: 0.00 ***10 Loans
## p-value of Chi-squared test: 0.09 *
## Survey Note: Original English Survey Question: "Last year, did YOU yourself borrow any money from anyone? Including friends, banks, money lenders etc."## Within Ghana: p-value of Chi-squared test: 0.29
## Within CdI: p-value of Chi-squared test: 0.63
## Survey Note: Original English Survey Question: "Last year, did YOU yourself borrow any money from anyone? Including friends, banks, money lenders etc."| Summary Statistics | Group: Ghana (N = 387) | Group: CdI (N = 331) |
|---|---|---|
| Loan amounts (usd) | ||
| min | 1.04 | 0.06 |
| max | 1305.8 | 498.0 |
| median (IQR) | 261.16 (104.46, 391.74) | 83.00 (37.35, 166.00) |
| mean (95% CI) | 299.13 (272.10, 326.16) | 127.26 (114.67, 139.85) |
## p-value of One way ANOVA test: 0.00 ***
## Survey Note: Remove Outliers (4sd) applied to values above 0 per country| Summary Statistics | Group: Ghana Female head (N = 78) | Group: Ghana Male head (N = 309) | Group: CdI Female head (N = 40) | Group: CdI Male head (N = 291) |
|---|---|---|---|---|
| Loan amounts (usd) | ||||
| min | 1.04 | 15.67 | 8.30 | 0.06 |
| max | 1305.8 | 1305.8 | 332.0 | 498.0 |
| median (IQR) | 169.75 (52.23, 313.39) | 261.16 (130.58, 470.09) | 83.00 (33.20, 166.00) | 83.00 (40.67, 166.00) |
| mean (95% CI) | 243.55 (190.38, 296.71) | 313.16 (282.24, 344.09) | 101.84 (76.18, 127.50) | 130.75 (116.91, 144.59) |
## Within Ghana: p-value of One way ANOVA test: 0.04 **
## Within CdI: p-value of One way ANOVA test: 0.14
## Survey Note: Remove Outliers (4sd) applied to values above 0 per countryIf borrowed, from who?
## p-value of Chi-squared test: 0.00 ***
## Survey Note: Original English Survey Question: "Were you able to repay the loan within the agreed repayment period?"## Within Ghana: p-value of Chi-squared test: 0.63
## Within CdI: p-value of Chi-squared test: 0.70
## Survey Note: Original English Survey Question: "Were you able to repay the loan within the agreed repayment period?"## p-value of Chi-squared test: 0.00 ***
## Survey Note: Original English Survey Question: "What did you use for collateral?"## Within Ghana: p-value of Chi-squared test: 0.12
## Within CdI: p-value of Chi-squared test: 0.18
## Survey Note: Original English Survey Question: "What did you use for collateral?"